Data Analyst with 10+ years of experience across finance, project management and business operations in Nigeria — including a CFO role — now applying that judgment to Excel, SQL and Power BI. I turn messy data into dashboards and recommendations that leadership actually acts on. My flagship analytics projects examine anaemia among Nigerian women and children using 2018 Demographic and Health Survey (NDHS) data.
4,415anaemia cases analysed from 33,924 survey records
100%on-time project delivery at Swiftdorf
5relational SQL tables designed
Projects
Anaemia Among Women in Nigeria: Public Health Analysis
Power BIExcelData CleaningData VisualizationHealthcare AnalyticsNDHS 2018
Problem. Anaemia affects women's health and maternal outcomes, but cases are not spread evenly across communities. Which groups carry the most cases, and where are the gaps in iron supplementation?
What I did
Prepared a 33,924-row survey extract in Excel (17 variables: wealth, education, residence, births, haemoglobin, iron intake) and trimmed it to 12 analysis columns.
Removed non-anaemic and blank records, leaving 4,415 respondents with mild, moderate or severe anaemia.
Built an interactive Power BI dashboard and presented findings in a 10-slide case study deck.
What I found
Moderate anaemia was the most common level (2,358 of 4,415 cases, 53%).
The poorest wealth group had the most cases; the richest had the fewest.
Rural respondents had more cases than urban respondents.
57% had their first birth between ages 12 and 19. Average haemoglobin: 104.08 g/L.
81% were not taking iron pills, sprinkles or syrup, and iron use rose with wealth: 10.8% in the poorest group against 28.5% in the richest.
Page 2, The Pattern: who the 4,415 cases are, by age, wealth, education and residence.Page 3, The Gap: age at first birth, haemoglobin by recent births, and iron-pill use by wealth index.
Recommendation. Focus screening, iron-supplement awareness, and nutrition education on poorer and rural communities, and build anaemia education into existing maternal and child-health programmes, with a focus on women in their 20s and early 30s.
Power BIData VisualizationKPI ReportingSales Analytics
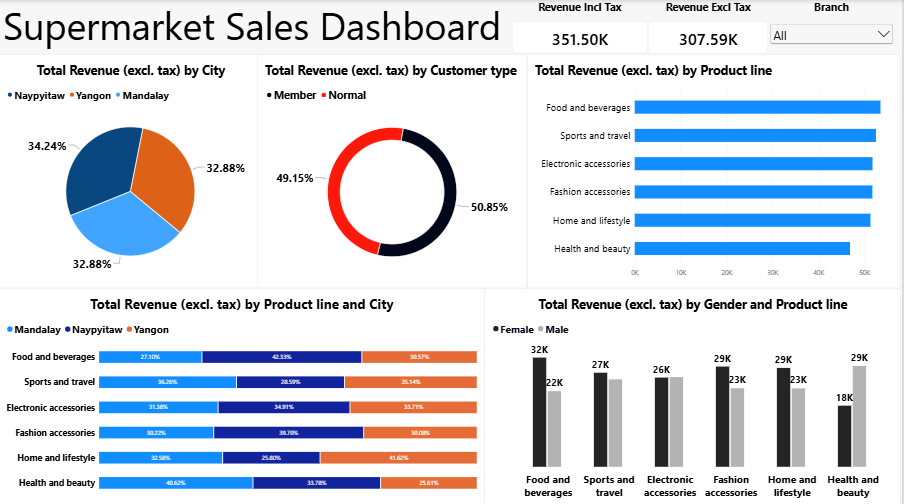
Goal. Show where supermarket revenue comes from across cities, customer types, product lines and gender. This is the same dataset as my Excel dashboard, rebuilt in Power BI.
Revenue by city, customer type, product line and gender.
What I did
Built KPI cards for revenue with and without tax, and a branch slicer.
Added charts by city, customer type, product line and gender.
What I found
Sales before tax were 307.59K. The recorded tax (43.9K) had 117 entry errors, so revenue including tax is overstated.
Naypyitaw led the cities (34.24%) and members made up 50.85% of revenue.
Food and beverages earned the most, and men spent more than women on Health and beauty.
Data CleaningExcelData QualityData ValidationData Wrangling
Worked through a deliberately messy sales dataset and fixed each issue category: duplicates, outliers (age 150, a ₦3,000,000 unit price), inconsistent text and gender entries, missing values, wrong data types, irrelevant columns, and business-logic errors (negative quantities, 150% discounts, delivery before order date).
Tools: TRIM, PROPER, UPPER, VALUE, DATEVALUE, COUNTIFS, Remove Duplicates, conditional formatting, Data Validation dropdowns. Principle I follow: flag and investigate before deleting.
Clean, aggregate and analyse operational and acquisition data in Microsoft Excel to support daily business activities and reporting.
Manage acquisition records so datasets stay accurate, complete and structured for operational use.
Prepare periodic business reports that monitor performance metrics, identify data gaps and support management decisions.
Filter, transform and present raw business data in clear, decision-focused summary formats.
Operations Project Manager
Swiftdorf Nigeria Limited · Feb 2020 – Apr 2025
Built KPI monitoring systems and performance dashboards to track project timelines, budget burn rates and resource use.
Analysed historical execution bottlenecks to put in place proactive risk mitigation, achieving 100% on-time delivery across concurrent projects.
Translated technical and project metrics into clear visuals and summary reports for senior executives.
Operations Manager / Chief Finance Officer
Bokan Oil & Gas Limited · Sep 2017 – Jan 2020
Led financial modelling, cash-flow analysis and annual budgeting to direct corporate strategy.
Ran expense variance analysis to find operational redundancies and put in place targeted cost controls that improved margins.
Business Development Manager
Omo-Gaye Enterprise · Mar 2013 – Aug 2017
Analysed industry sales trends and consumer demographics to identify untapped market opportunities and set data-backed sales targets.
Skills
Tools
Microsoft Excel (Power Query, pivot tables, complex formulas), SQL / MySQL, Microsoft Power BI (DAX, data modelling), Microsoft Azure fundamentals, Office 365, Google Workspace
Analysis
Data cleaning, data wrangling, exploratory data analysis (EDA), trend analysis, KPI tracking, dashboard design, data visualization
Financial & Operational
Financial reporting, variance analysis, budgeting and forecasting, expense reconciliation, process optimization, inventory analytics
Education & certifications
B.Sc. EconomicsDelta State University, Abraka · 2012
EntrepreneurshipNational Open University of Nigeria (NOUN), Abuja
Data Analytics & AI Programme, Ihifix Scholarship ProgrammeCompleted 2026
Mastering Data Analysis Using Microsoft Excel, AlisonCompleted August 2026
Introduction to Microsoft Azure Cloud Services, Coursera
I like questions where the answer changes what someone does — where to send a health outreach team, which product line to stock, or where a budget is quietly leaking. After a decade in finance and operations, I'm building that same judgment into Excel, SQL and Power BI. I'm looking for a Data Analyst or Business Intelligence role where I can bring both.